Saturday, January 31, 2009

Important Economic Indicators

Are we in a bull market or a bear market? Is the US economy improving--or are things just getting worse?

The slide presentation below provides a snapshot of key economic indicators--some of the important ingredients that shows if the US economy is vibrant & healthy.

Many of the slides come from BullandBearWise.com This organization provides regular updates as new information is released. From time-to-time I will update this particular blog article with the latest news.

Before viewing the slides, it would be instructive to discuss these indicators:

Bull/Bear Index This is a composite index of the state of the US economy.

Gross Domestic Product (GDP) This is the total cost of all finished goods and services produced. See That GDP for more information.

TED Spread The TED spread is a common measure of fear and risk in the capital markets. See Where's TED Now for more information.

Inflation Right now deflation is an important concern. This slide provides a hint as to the direction of that risk.

ISM Manufacturing Index Any reading above 50 is considered a healthy sign for US manufacturers. These companies often make Durable Goods and Export products, hence those two charts follow.

ISM Non-Manufacturing Index Comparable to manufacturing, this measures the health of the US services industry. The Retail Sales chart provides further detail.

Housing Market Index This is comparable to the manufacturing & services indexes. Again, a reading above 50 is healthy. This is supported by the Housing Affordability Index--and indication of whether buyers can, in general, afford to purchase homes.

Unemployment Rate This is a vital measure of the US workforce--and naturally a low unemployment rate means workers can afford to buy durable goods, services & homes. Consumers are one of the key drivers of US economic growth. The Initial Jobless Claims report provides a glimpse of where the unemployment rate is trending.


Wednesday, January 28, 2009

That GDP

Gross Domestic Product, or GDP. Such an arcane term...such an important number.

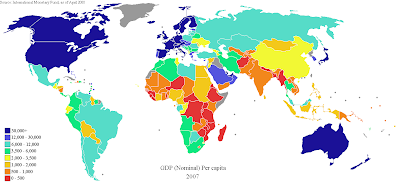
Every country has a GDP. The US GDP in 2007 was $13.8 trillion.

Some nations are quite wealthy, per capita. Others are quite poor.


We want to see a steady increase in the GDP. For a mature nation like ours, a 3% annual increase is nice. When we see it decline, especially for two successive calendar quarters, we call it a "recession."

A healthy GDP helps answer the questions:
  • Will I have a job?
  • Can I afford to buy things?
  • Will I earn money on my investments?
  • Can I afford to retire?

So just what is a "GDP?" It is the total cost of all finished goods and services produced.

Let's picture what this is. GDP is the sum of four items:

1. Personal consumption. This is what we spend on food, rent, medical expenses and so on.


2. Business and household capital purchases. Examples for businesses include construction of a new mine, purchase of software, or purchase of machinery and equipment for a factory. For individuals, this would be for new houses.


3. Government spending. This includes salaries of public servants and purchase of weapons for the military. It does not include social security or unemployment benefits.


4. Exports to other nations, less what we import.


GDP per capita is often used as an indicator of standard of living in an economy, the rationale being that all citizens benefit from their country's increased economic production.

As such, it is a very broad measure...and as you can see, throughout the Middle Ages, poverty was the norm. In the recent decades, people in North America and Europe have become quite wealthy.

As we ponder the future, China and India, for example, may catch up to our standard of living.

Still, there is likely to be billions of people who live impoverished lives.

I guess when can be thankful--even the poorest in the US are relatively well off. And we should give thought to economic development & humanitarian efforts to help those in the world who are not as fortunate.

Wednesday, January 21, 2009

Obama's Recovery Plan

Christina Romer is the new chair for the Council of Economic Advisors. On January 9 she released a 14-page document on "The Job Impact of the American Recovery and Reinvestment Plan" to be presented to Congress.


The preliminary findings are:
  • The goal is creation of 3-4 million jobs by the end of 2010.
  • Tax cuts & fiscal relief to the states may create fewer jobs than direct increases in government purchases. However, there is a limit on how much government investment can be carried out quickly. Since tax cuts and state relief can be implemented quickly, they are crucial elements of any package aimed at easing economic distress.
  • Certain industries, such as construction and manufacturing, are likely to experience particularly strong job growth under a recovery package that includes an emphasis on infrastructure, energy and school repair.
  • More than 90 percent of the jobs created are likely to be in the private sector.

All of the estimates are subject to significant margins of error. Estimates of economic relationships and rules of thumb are derived from historical experience. Furthermore, the uncertainty is higher than normal because the current recession is unusual both in its fundamental causes and its severity.

The table shows that the plan could meet the goal of creating or saving at least 3 million jobs by the 4th quarter of 2010.

The U.S. economy has already lost nearly 2.6 million jobs since the business cycle peak in December 2007. In the absence of stimulus, the economy could lose another 3 to 4 million more. Thus, we are working to counter a potential total job loss of at least 5 million.

Keep in mind that job loss is an unfortunate by-product of this recession.

While this proposed recovery plan may prove helpful, it is the fundamental problem...linked to the liquidity crisis created last September, the fear that ensued and the remarkable decline in the velocity of money (ie, rate at which Americans are spending) that are at the root of this recession.

And of course that was precipitated by the housing bubble...and all the problems associated with sub-prime mortgage lending.

Hence, efforts that have been underway by Fed Chairman Bernanke & Treasury Secretary Paulson...and carried forward by new Treasury Secretary Geithner may play a much larger role in overall US recovery...as we have seen glimpses of already.

Wednesday, January 14, 2009

Bend Not Break

US banks were under great stress last year. This is a principal reason why the Troubled Asset Relief Program (TARP) was passed. Once the $700 billion was secured, Treasury Secretary Paulson considered how best to spread the wealth.

As it turned out, he decided to have a private meeting on October 13 with the leaders of the nine largest banks.

Each received a one-page document that said they agreed to sell shares to the government...and they were asked to sign it before they left the room!

The chairman of JPMorgan Chase said he thought the deal looked pretty good. The chairman of Wells Fargo protested strongly. He said his bank was not in trouble because of investments in exotic mortgages, and did not need a bailout.

At the conclusion of this 3 1/2 hour meeting, all nine chief executives signed. This put in motion the largest government intervention in the American banking system since the Great Depression.

Paulson presented his case in blunt terms. The nation's largest banks needed to begin lending to each other for the good of the financial system. To do that, they needed to be better capitalized.

Paulson was well aware of the stakes. If you look at the worst performing stocks last year, you'll see that all but one (ie, Circuit City) was a financial company.


Paulson's plea was that for the good of the country, these nine major banks needed to take the money. Paulson didn't have any particular terms for the use of the money. He simply wanted to see their balance sheets strengthened.

After dishing out $125 billion, he could then go to the mid-tier banks and ask them to accept money, too, in exchange for non-voting stock ownership by the US government, and other constraints on their business.

Did it work? Did this achieve Paulson's goal of stabilizing the banking system--and therefore averting collapse? Well, yes, it did. This is in part why were are seeing a bit of recovery in the US financial system, albeit it in the very, very, very early stages.

Following is a chart of the bank failure last year as compared to failures over the last four decades.